
Charts and Graphs Findings
These tools provide guidelines and tips on how to effectively use various charts and graphs to communicate research findings. The presentations will provide guidance on which chart types are best suited for which types of data and for which purposes, shows examples of preferred practices and practical tips for each chart type, and provides cautions and examples of misuse and poor use of each chart type and how to make corrections.
These tools are designed primarily for researchers from the Model Systems that are funded by the National Institute on Disability, Independent Living, and Rehabilitation Research (NIDILRR). The tool can be adapted by other NIDILRR-funded grantees and the general public.
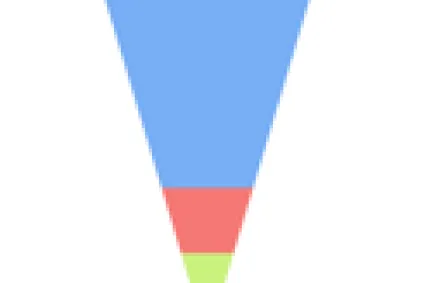
Effective Use of Funnel Charts
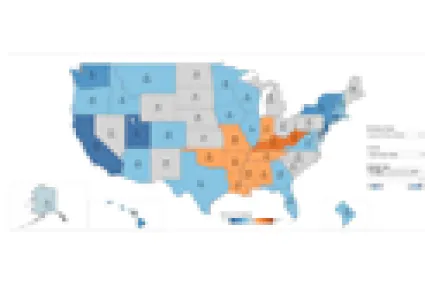
Effective Use of Geographic Maps
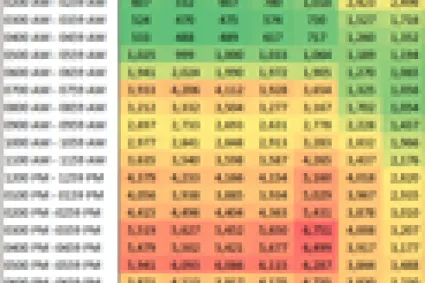
Effective Use of Heat Maps
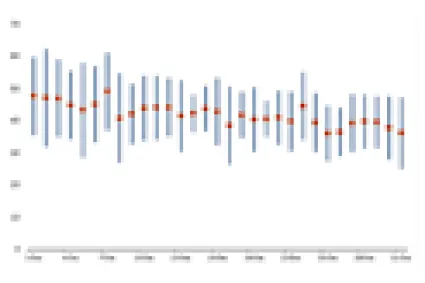
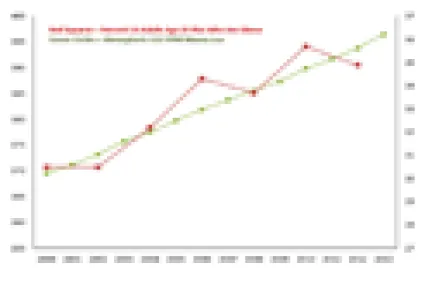
Effective Use of High-Low Charts
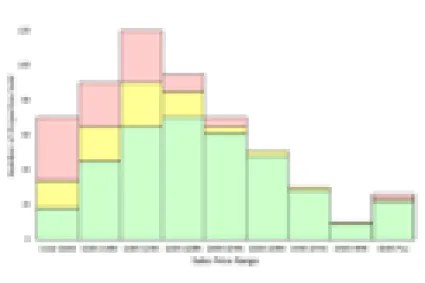
Effective Use of Histograms
Effective Use of Line Charts
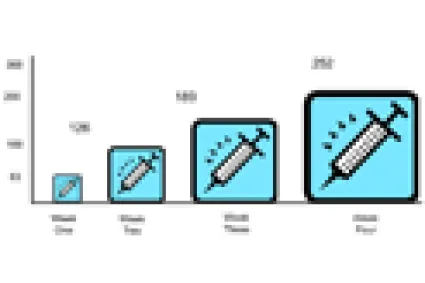
Effective Use of Pictographs
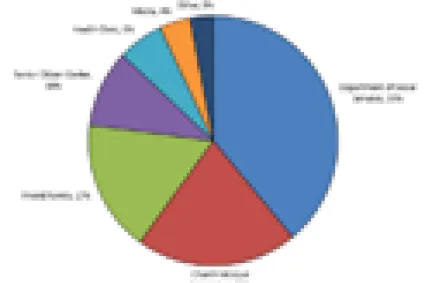
Effective Use of Pie Charts